Optimizing Staff Schedules
Posted on: August 10th, 2009The Smart Numbers of Staff Scheduling
Scheduling is a multi-variant analysis that requires the reconciliation of 10 variables per area:
- Modeled Patient Volumes
- Specific Skill Requirements
- Staff availability
- Staff FTE commitment level
- Acuity during a specific shift
- Physician Requests
- Actual Patient Volumes
- Benefit Commitments (holidays, weekends, PD contracts, etc . . .)
- Adherence to productivity measures
- The input of a central staffing office
In spite of this, there are some “Magic Numbers” to optimize a Schedule that most organizations aren’t aware of. Brilliant in their simplicity they are still profound in their impact on scheduling in the average healthcare entity. A fun exercise is to calculate each of these separately for every cost center in your organization and then check the results against premium pay utilization for each area! The correlations can be frightening!
- There is an Optimal % of FT to PT/Short hour staff ratio (60/40) and when it deviates by more than 3% in either direction, staff quickly gain control of the schedule. With too many short hour employees on the roster, staff can “withhold” labor by simply NOT signing up for shifts – forcing the organization to provide premium pay in order to get them to work. With too few, resources become tight and life-circumstances (sick staff or child, etc . . .) can leave a schedule without enough flexibility to be filled (resulting in uncovered shifts).
- There is an Optimal % of 12 HR to 8 HR shifts and while it can deviate downwards from 70/30 (70% 12HR and 30% 8HR) when the % of 12 Hour staff climbs above 70%, the schedule also becomes too rigid and gaps are often found. However, no derogatory effect has been found from lower levels of 12 Hour shifts.
- There is an Optimal Labor Cost as a % of Operating Revenue number (above which margin erodes quickly). For most adult acute hospitals, the magic number is 59% (SEE “Labor/Margin” graphic above”) for others it can happen at much lower labor costs depending on their reimbursement rates, case mixes and levels of competition.
Partial People Math
Partial people math is the phenomenon that occurs in organizations that due to the rigidity of RN staffing ratio’s and department definitions are limited in their ability to move staff and patients readily. This results in nurses in multiple departments who each carry less than the full patient load that ratios allow (Not including “sitter” needs).
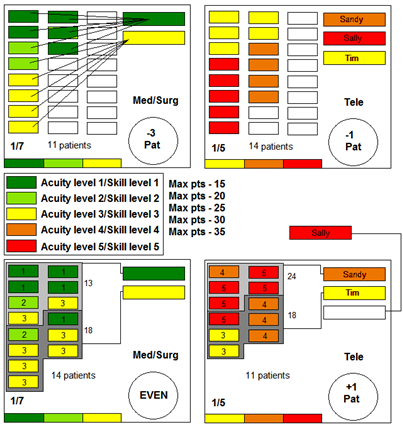
In the average organization, partial people math represents an average of 7.5 RN FTE’s per year per 100 beds. In rigidly controlled organizations with tight/mandatory nurse/patient ratios, this waste can exceed 15 RN FTE’s per year per 100 beds. An example of this appears in the graphic on the right:
Example: in this example the top represents an organization who is challenged to move patients and staff between units. The med/surg floor operates on a 1:7 ratio but one nurse has only 4 patients (meaning the nurse is underutilized by 3/7ths). The bottom sample shows that by moving patients between 1 unit and another, that one RN less is needed.